2025 Dining Trends Report: The Latest Restaurant Industry Trends
Uncover the top dining trends based on our survey of 1,500+ American diners.

Download the
Report Highlights
of diners are ordering takeout/delivery once a week or more often
of diners say they’re motivated to visit a restaurant with a limited time offering (LTO)
of diners are comfortable with technology in restaurants
2025 American Diner Trends Report
Hungry for the latest consumer dining trends?
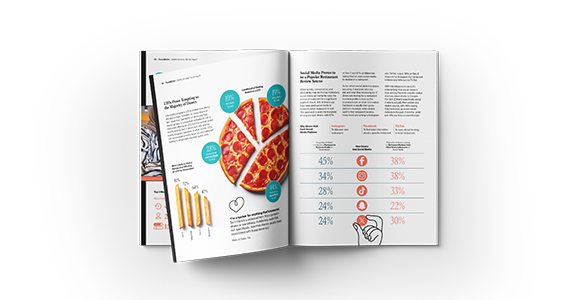
To reveal the top dining trends, we partnered with The Harris Poll to survey 1,500+ American diners from across the country. With extensive dining out statistics and restaurant industry trends, our report reveals what consumer dining trends operators should keep in mind to beat out the competition and win over American diners.
Below you’ll find a sneak peek at the latest dining habits and restaurant industry trends shaping 2025. Download the full industry report to uncover the latest trends in foodservice and what they mean for the year ahead.
Dining Frequency Has Increased with Takeout/Delivery Outpacing Dine-In
Americans are feeling the pinch of a higher cost of living – but is it actually changing how often they dine out? Surprisingly, not by much. In fact, 42% of consumers say they dine out at least once a week, up from 39% last year. While this is optimistic news for restaurant operators, the trend isn’t universal – households earning under $50K are seeing a different reality. Meanwhile, takeout and delivery continue to dominate. In 2024, 44% of consumers ordered takeout or delivery at least once a week, up from 42% the year before.
So, what’s really driving these shifts in Americans’ dining habits, and what does it mean for the industry?
download the reportFrequency of Going Out and Ordering Takeout/Delivery in 2024
Spend on Takeout and Dine-In Soars, But Tips Plateaued
After years of rising menu prices, it’s no surprise that restaurant checks are getting bigger. This year, diners reported spending an average of $54 when dining out at a restaurant – up from $48 in 2023, with Millennials and Gen X leading the way as the biggest spenders. But what about tipping? Despite the higher bills, most diners aren’t adjusting their tipping habits – 61% say they’re tipping the same as last year.
The same consumer dining trends are true for takeout and delivery. Average spend jumped to $38 per order (up from $31 in 2023) but tipping hasn’t budged – 64% of diners say that they haven’t changed how much they tip on takeout/delivery.
Want the full scoop on how diners are spending (and tipping)? Our full report reveals these restaurant consumer trends and more.
download the reportAverage Spend and Tip When Dining Out and Getting Takeout/Delivery
Average Spend When Going Out to Eat
Average Spend When Getting Takeout/Delivery
Average Tip When Going Out to Eat
Average Tip When Getting Takeout/Delivery
DoorDash is the Clear Favorite Among Third-Party Delivery Apps
Delivery apps are still a go-to for many diners, despite most prefer ordering directly from restaurant staff when given the option. When it comes to favorites, one app takes the cake – DoorDash is the clear favorite across all generations, with 73% of diners saying they use it. Uber Eats follows in second place, with 56% of diners using the platform, while Grubhub trails at 34%.
Curious about what’s driving these preferences and how they impact restaurants?
download the reportThird-Party Delivery Apps Used by Diners
Are American Diners Seeing Stars?
For the average diner, a MICHELIN Star – or even a mere feature in the MICHELIN Guide – doesn’t hold much sway. Only 35% say it influences where they eat. However, for younger generations, this designation carries more weight. Half of Gen Z and Millennials say they would be more likely to visit a MICHELIN-starred restaurant, compared to just 33% of Gen X and only 16% of Boomers, making this one of the most notable Millennial and Gen Z dining trends.
Are younger diners shaping the future of where and how we eat? Our report reveals whether these restaurant consumer trends are here to stay.
download the reportLikelihood of Visiting a Restaurant Based on MICHELIN Star and Guide Status
of diners would be more likely to visit a restaurant with a MICHELIN Star
of diners would be more likely to visit a restaurant featured in the MICHELIN Guide
Time is Money for American Diners
For most diners, negative feedback from a friend is the top reason they would be deterred from visiting a restaurant – ranking even higher than a recent health inspection warning or a long wait time. A wait time over 30 minutes is enough to turn diners away, with the average guest only willing to wait 22 minutes for a table. The same goes for takeout and delivery, where diners expect their orders in just 29 minutes – down a minute from the year prior.
In the restaurant world, every minute counts. Want to know what other trends in foodservice keep diners hungry for more (or heading for the door)?
download the reportReasons Diners Would be Deterred from Visiting a Restaurant
Negative feedback from friends
A recent health inspection warning
A table wait time over 30 minutes
Bad online reviews (i.e. bad Google reviews, etc)
Service charges (i.e. 15% service charge on all bills)
Traditional Service is Still Preferred Over Tech
While diners are open to tech – and even AI – in restaurants, they draw the line when it disrupts traditional service. 74% still prefer viewing a physical menu and ordering directly from a server – one of many compelling dining out statistics in this year’s report. Even when it’s time to pay, tradition wins out – 51% would rather their server process payment away from the table. For restaurant operators, adapting to these restaurant trends presents a unique challenge. The right tech can enhance the experience, but the wrong move could leave diners with a bad taste.
Want to know which innovations are worth the investment?
download the report#1 Preferred Way to Place an Order at a Restaurant
prefer viewing a physical menu and speaking directly with a server when placing an order
Methodology
TouchBistro partnered with research firm The Harris Poll to survey 1,500 diners in the U.S. Our research was conducted from October 15 to October 25, 2024. Survey results are accurate +/- 3% for the general population of American diners.
The complete respondent profile can be found inside the report.
Explore TouchBistro
Need help navigating the latest trends?
TouchBistro’s all-in-one restaurant management system is equipped with all the front of house, back of house, and guest engagement solutions you need to run and grow your business.
See PricingFront of House
Deliver the speed and quality of service that guests expect.

Back of House
Control costs and run your kitchen more efficiently.

Guest Engagement
Engage guests in-venue and online to keep them coming back for more.

Success! Click below to access the download.
We’ve also sent you a confirmation email with a personal download link so you can access the content at any time.
download now